Lab Results
Panels and results
Lab data is organized into panels — a single lab order or report, like a Complete Blood Count or a Lipid Panel — each containing one or more results. A panel has a status (registered, preliminary, final, amended, or cancelled), the ordering provider, the performing lab, and the date it was performed. Each individual result within it carries its own LOINC code, value, unit, reference range, and interpretation.
Adding a panel
Start typing a panel name — "CBC," "lipid," "thyroid" — and an autocomplete suggests standard panels with their LOINC codes already attached, drawn from a curated list of the most common orders plus a live search against the full public LOINC terminology for anything more specific. The same autocomplete pattern applies to individual test names within a panel.
Interpretation and reference ranges
Each result can be marked Normal, High, Low, Abnormal, or Critical. If you enter a reference range (low/high, or a text range like "Negative"), the app compares your value against it and suggests High/Low/Normal automatically — you always have the final say, and Critical in particular is never auto-assigned, since that's a clinical judgment call, not just a threshold.
Critical value notifications
Marking a result Critical immediately triggers an in-app notification, so a critical value entered — whether by you or a caregiver — doesn't just sit unnoticed in a list.
Two ways to browse
The lab results view offers two modes:
- By Panel — a chronological list of panels, each expandable to show its results, closest to how a lab report actually reads.
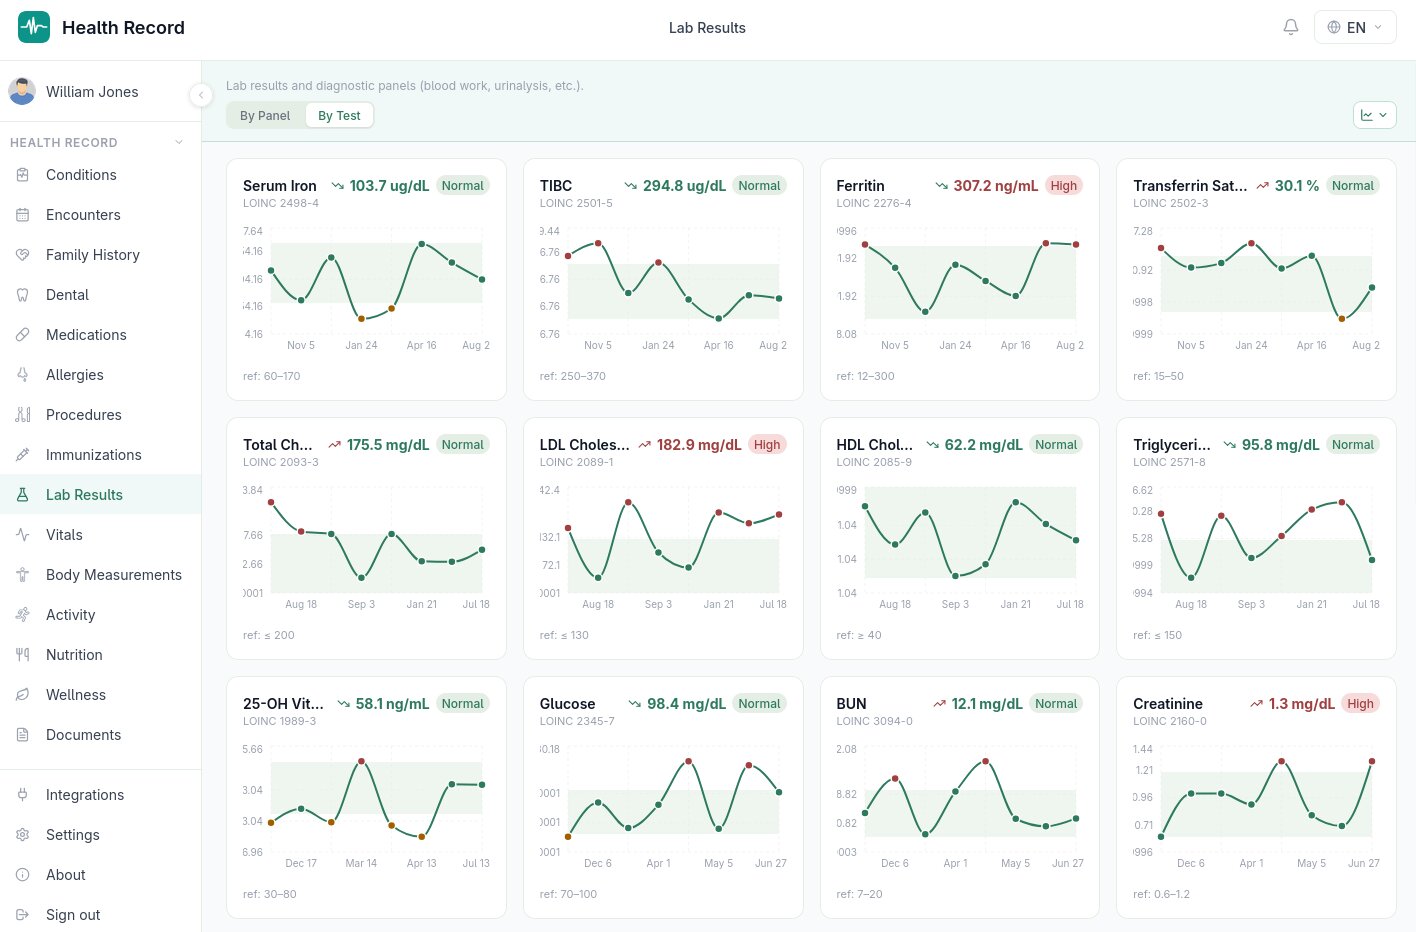
- By Test — the same results regrouped across every panel by test name (matched on LOINC code), so you can see every glucose reading you've ever had in one place regardless of which panel it came from. This view includes a trend chart per test with the reference range shaded in the background and each point colored by its interpretation, so an out-of-range trend is visible at a glance.
Standards behind the data
Lab results use LOINC — the same coding system real laboratories use to identify exactly which test was performed. This is what makes the data exportable into FHIR Observation/DiagnosticReport resources, HL7 v2 OBX segments, and CDA documents that another system can actually parse, not just display.